


Apps Security Threats Report 2025
by .freeRASP
(Released: Sep 2025)
A data-driven look at the global state of
mobile app security.

Source of Data:
Apps protected with freeRASP
Apps protected with freeRASP
Devices
365 898 764
Apps analyzed
5000+
What is freeRASP?
freeRASP is Community Edition of Runtime App Protection tool (SDK) by Talsec that protects Mobile Applications all around the world — safeguarding millions of mobile users from fraud, tampering, and emerging cybersecurity threats every single day. With a presence across continents and industries, our detection network continuously monitors real-world attacks and security anomalies to keep applications safe.
The report summarizes the key findings from Talsec’s continuous monitoring efforts, highlighting the most active threat areas and the techniques used to compromise device integrity and application trust. These insights empower organizations to anticipate risks, adapt defenses, and improve the safety of their mobile ecosystems.
The report summarizes the key findings from Talsec’s continuous monitoring efforts, highlighting the most active threat areas and the techniques used to compromise device integrity and application trust. These insights empower organizations to anticipate risks, adapt defenses, and improve the safety of their mobile ecosystems.
Global Threat Rate Map


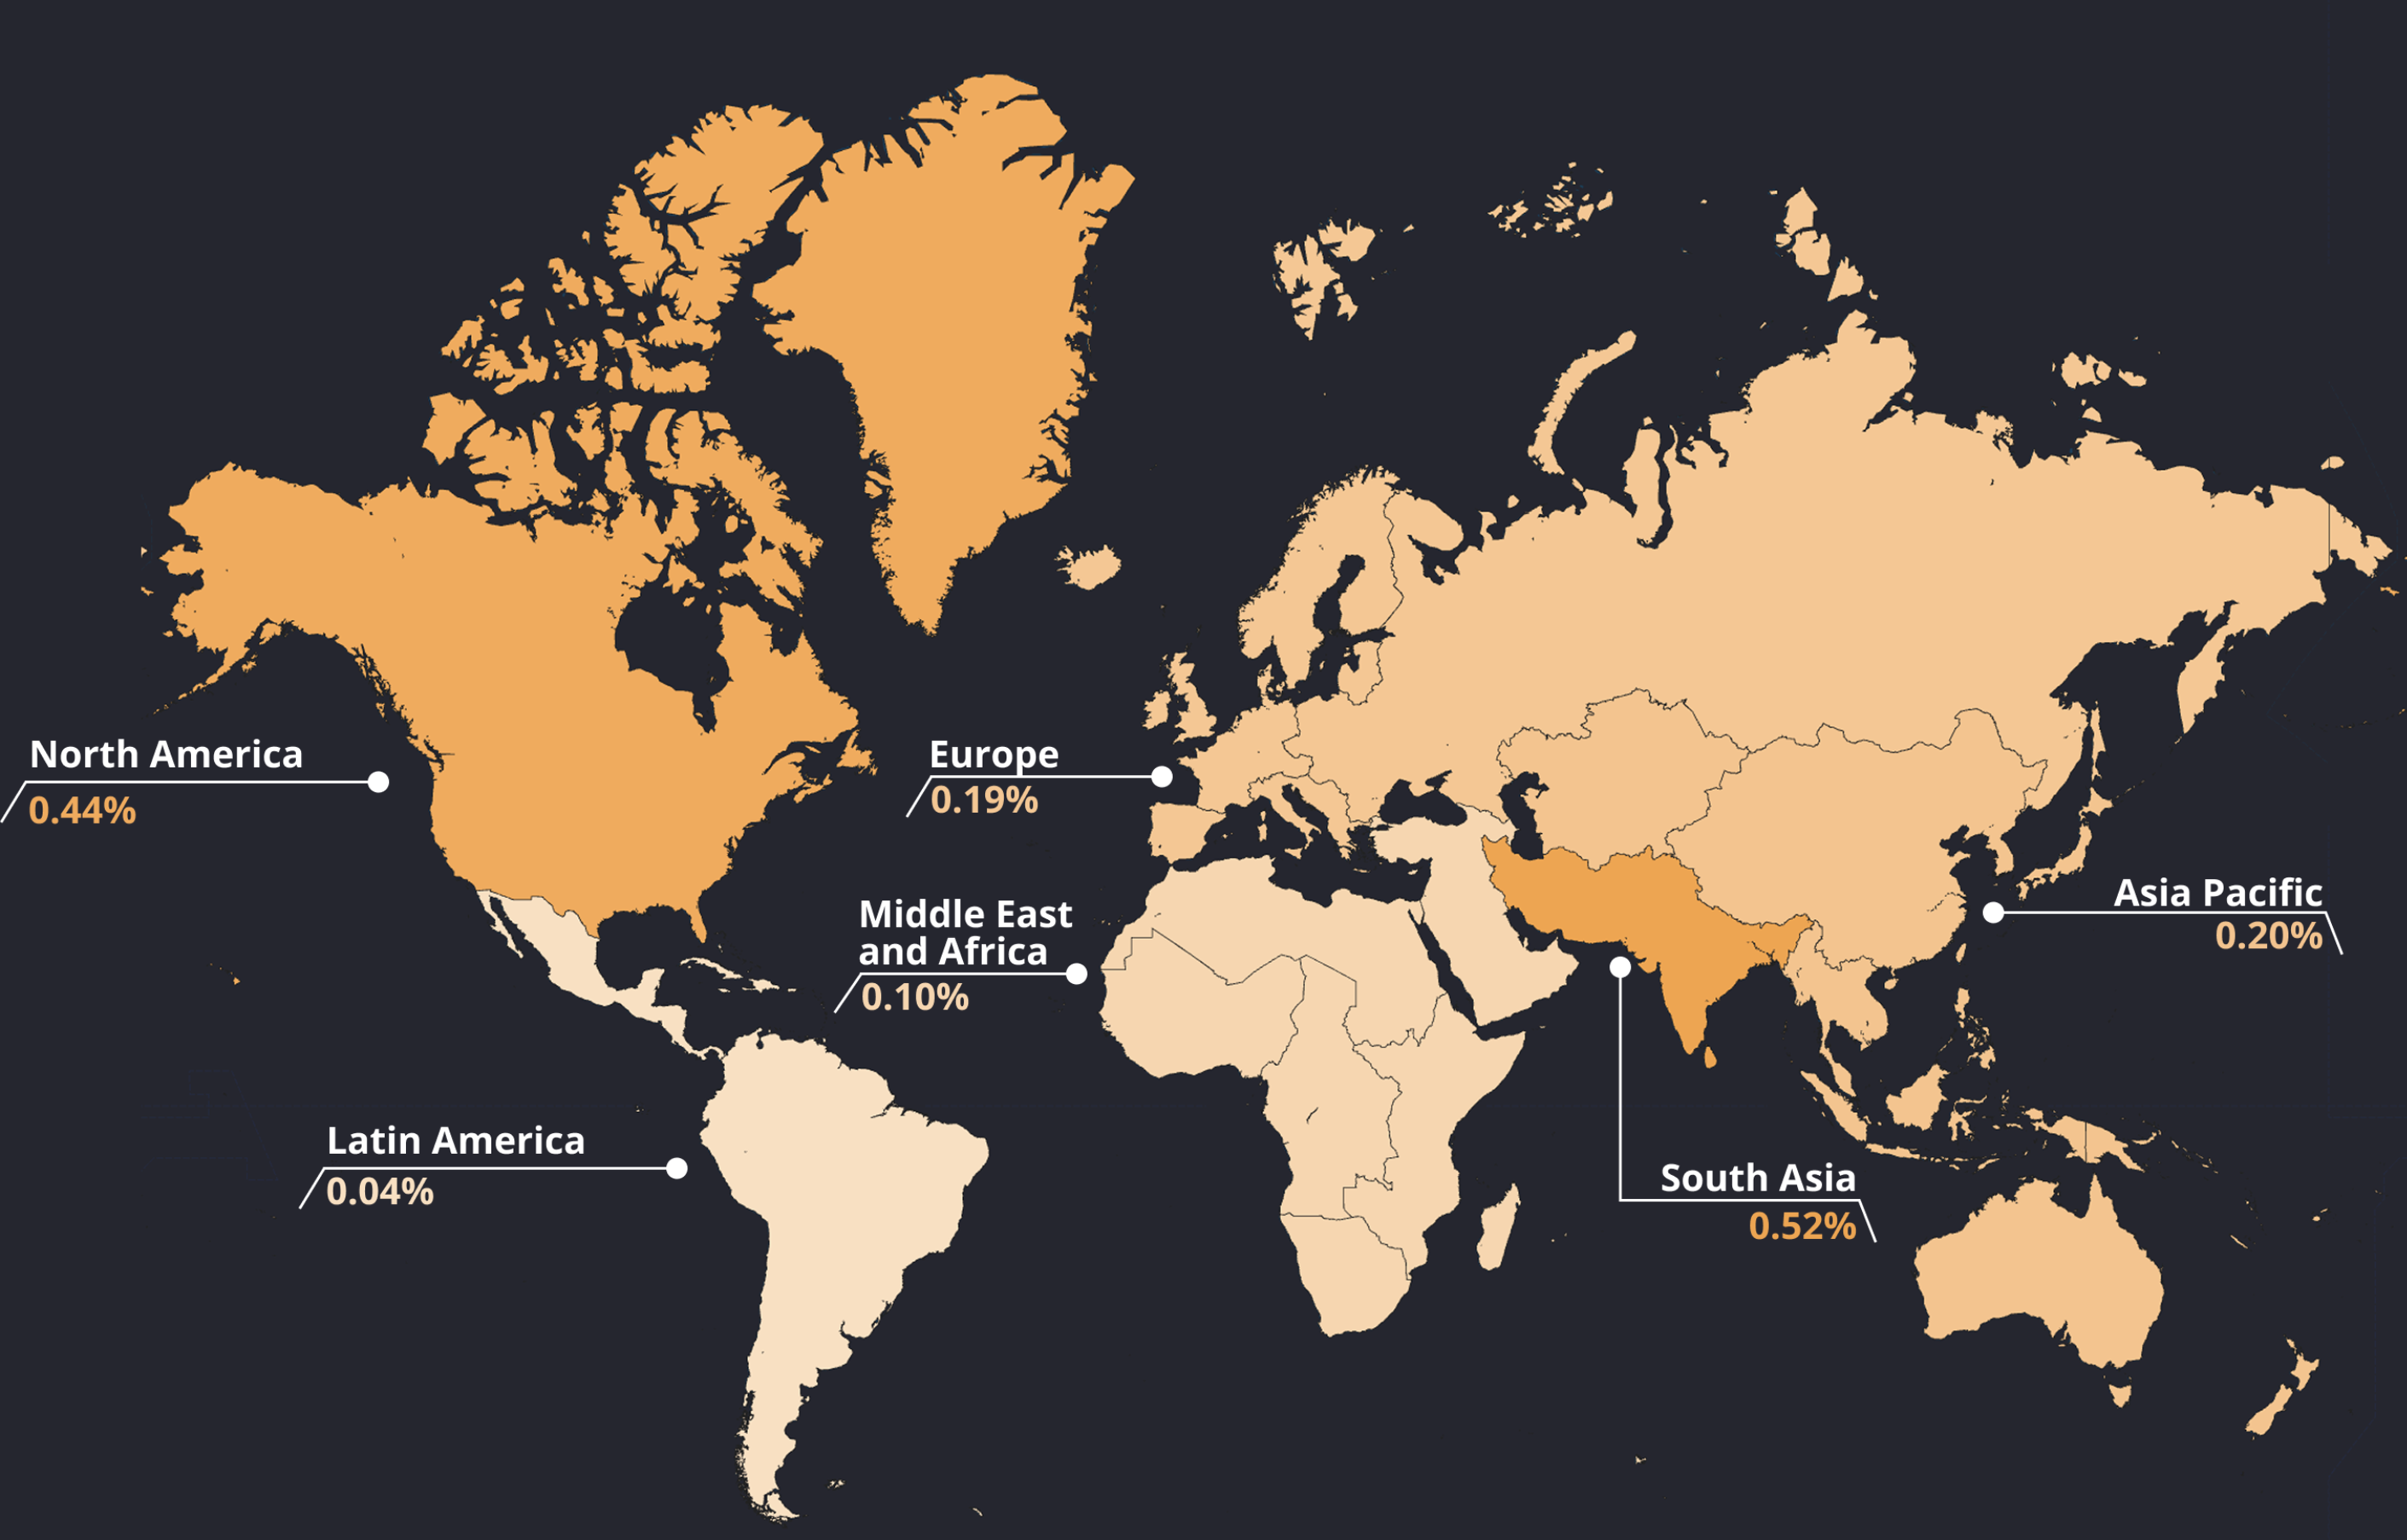

Threat Groups
Critical
- App Tampering
- Debugging
- Hooking
Warning
- Screenshotting
- Screen Recording
- System VPN
- Developer Mode
- ADB Enabled
Major
- Root/Jailbreak
- Unofficial Store
- Simulator

Descriptions and detailed statistics for the threat groups are below.
Data Explanation
From Critical threat group, the mostly targeted region is North America. These threats emerge mostly from the tampering and hooking incidents.
From Major threat group, North America and South Asia are most targeted regions, emerging mainly from unofficial store and rooting/jailbreaking incidents.
From Warnings threat group, North America and Europe are most targeted regions, emerging mainly from turned on VPN or screenshots and screen recording incidents.
App Distribution Risks
App distribution risks occur when an application is compromised or delivered through insecure or unauthorized channels. Attackers may modify an app’s code, repackage it, or upload it to unofficial stores, exposing users to counterfeit or unsafe versions. Such threats target the integrity of the distribution process and can result in tampered, outdated, or malicious variants reaching unsuspecting users.
App Tampering
Tampering occurs when an attacker deliberately modifies an application after it has been released, altering its behavior or functionality without the developer’s consent. This can include injecting malicious code, removing security protections, or changing features to bypass licensing or monetization controls.
It is one of the most direct threats to app integrity, as only the legitimate developer holds the original signing key. Standard signature checks during installation only verify that the app is signed—they do not confirm that it was signed with the expected developer key. As a result, tampered apps can bypass normal installation validation and reach end users.
It is one of the most direct threats to app integrity, as only the legitimate developer holds the original signing key. Standard signature checks during installation only verify that the app is signed—they do not confirm that it was signed with the expected developer key. As a result, tampered apps can bypass normal installation validation and reach end users.

Data Explanation
The chart shows the share of devices that experienced an app tampering incident by region. Incidents are uncommon in percentage terms but meaningful at scale.
North America stands out at 0.131%, followed by Europe at 0.058%. South Asia registers 0.016%, Asia Pacific 0.009%, and both the Middle East & North Africa and Latin America come in lowest at 0.005% each.
In relative terms, North America sees roughly 2.3 times the rate observed in Europe and about eight times South Asia; it is more than fourteen times Asia Pacific and around twenty-six times MENA and Latin America. These gaps may reflect attacker focus on more developed countries.
Regional distribution of Tampering incidents
Unoffical Store
An unofficial store incident indicates that the source of an app’s installation is not approved. This typically occurs when an app is installed from a third-party store that hasn’t been authorized. Such installations compromise supply chain integrity and can expose users to high-risk versions of otherwise trusted software.
While third-party stores offer consumers more freedom of choice, they make it harder for businesses to ensure that apps are secure and compliant. Many alternative stores do not follow best practices and allow apps to be uploaded without adhering to Google or Apple policies, or even contain malware. In some cases, your app—potentially modified with hidden malware or removed paywalls—could appear on these stores without your knowledge, allowing users to download it freely.
While third-party stores offer consumers more freedom of choice, they make it harder for businesses to ensure that apps are secure and compliant. Many alternative stores do not follow best practices and allow apps to be uploaded without adhering to Google or Apple policies, or even contain malware. In some cases, your app—potentially modified with hidden malware or removed paywalls—could appear on these stores without your knowledge, allowing users to download it freely.
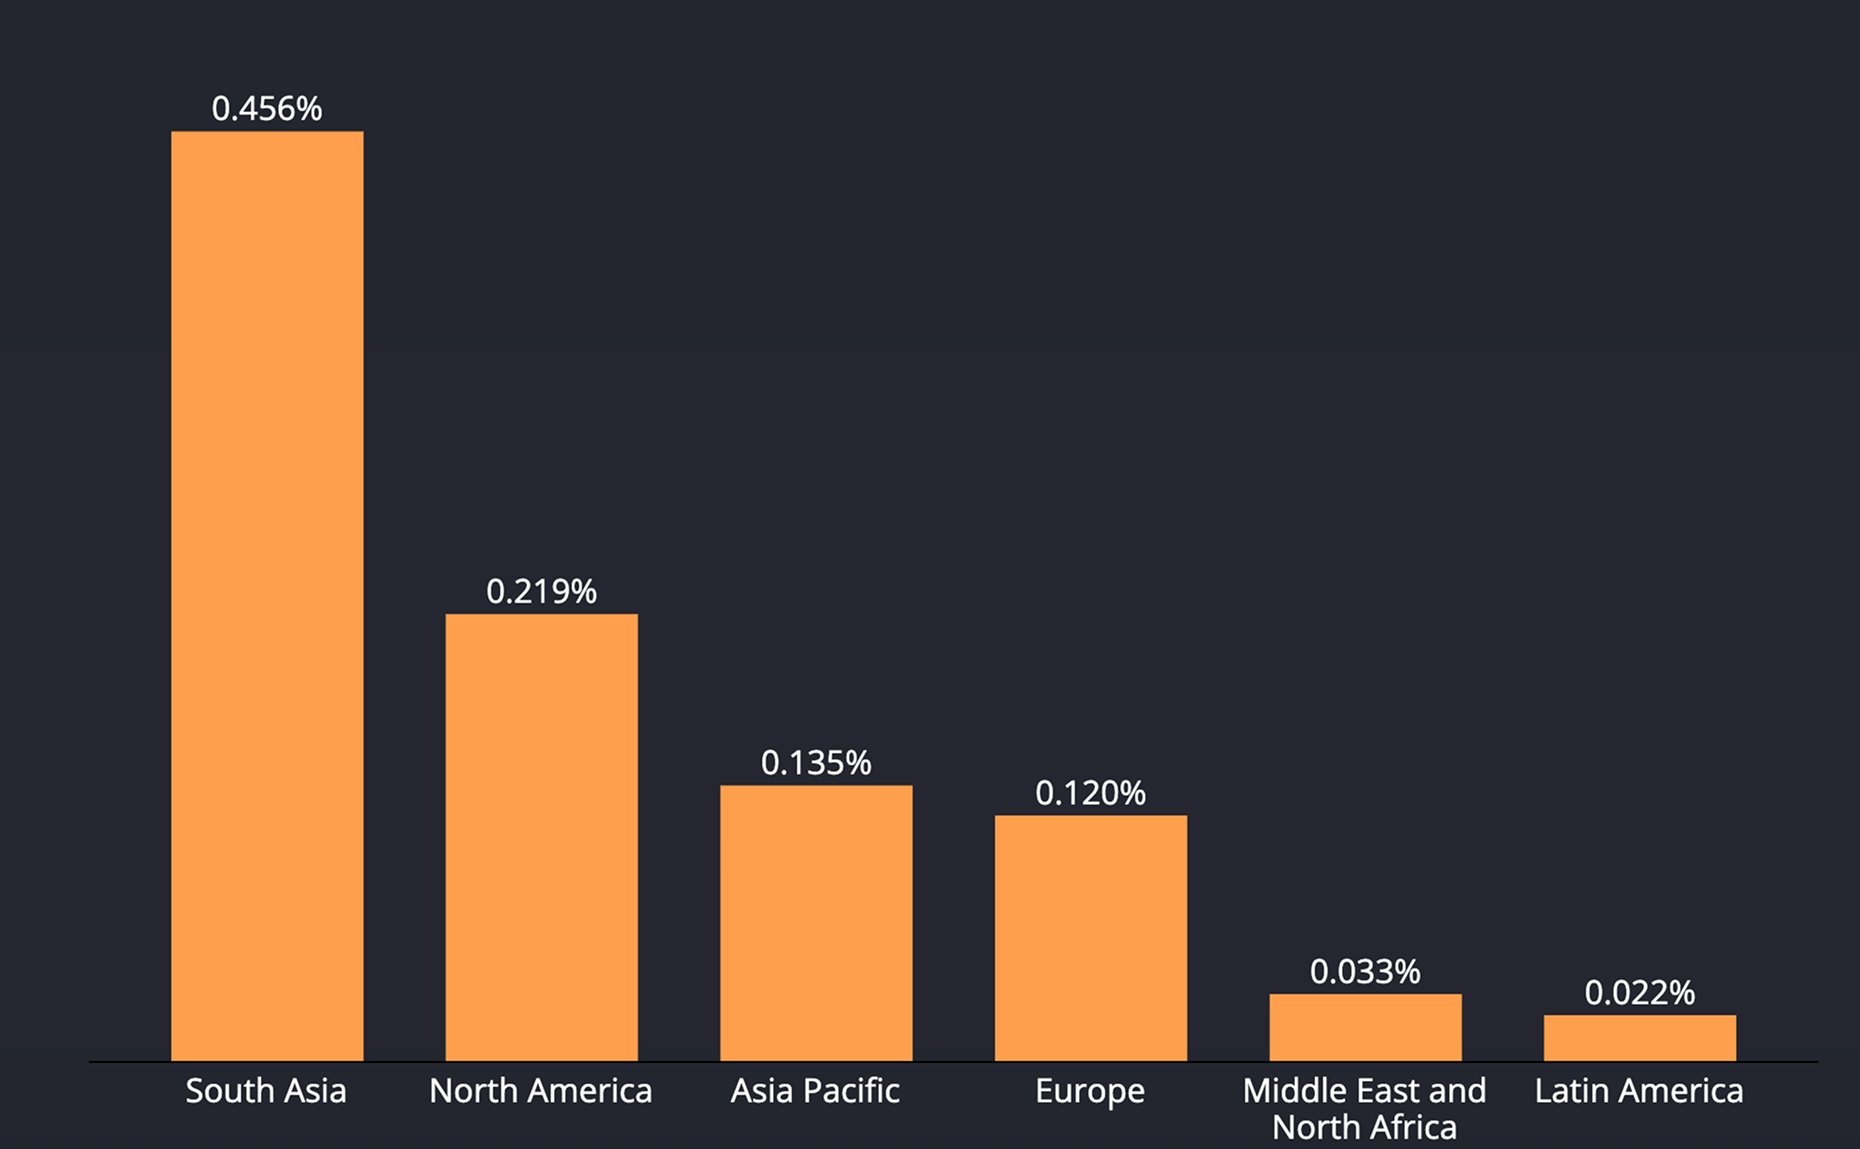
Data Explanation
The chart shows the share of devices that experienced an unofficial store incident by region.
South Asia leads at 0.456%, followed by North America 0.219%, Asia Pacific 0.135%, Europe 0.12%, the Middle East & North Africa 0.033%, and Latin America 0.022%.
In relative terms, South Asia sees about 2.1 times North America, 3.8 times Europe, and 3.4 times Asia Pacific; North America is 1.8 times Europe and roughly 6.6 times MENA and 10 times Latin America.
These gaps track where third-party marketplaces (or mover & cloning apps) dominate distribution making unofficial installs more common.
Regional distribution of Unofficial Store incidents
Runtime Attacks
Runtime attacks target the live execution environment of an application rather than its static code. They exploit weaknesses that appear once the app is running, such as in-memory manipulation, debugging abuse, or dynamic code tampering, to gain control over sensitive operations.
Hooking
Hooking is when someone injects code into an app while it is running so they can observe or change what the app does. Tools like Frida let attackers read sensitive data, bypass checks, or disable protections such as certificate pinning.
Hooking remains a favored tactic for both testing defenses and active exploitation. There are plenty of scripts online which enables bypassing of various security checks. Hooking is often times detected together with rooting and jailbreaking.
Hooking remains a favored tactic for both testing defenses and active exploitation. There are plenty of scripts online which enables bypassing of various security checks. Hooking is often times detected together with rooting and jailbreaking.

Data Explanation
The chart shows the share of devices that experienced a hooking incident by region.
North America stands out at 0.202%, followed by Asia Pacific at 0.075%, South Asia 0.063%, the Middle East & North Africa 0.045%, Europe 0.029%, and Latin America 0.008%.
In relative terms, North America sees roughly 2.7 times Asia Pacific, 3.2 times South Asia, 4.5 times MENA, 7 times Europe, and about 25 times Latin America.
Higher North American rates reflect stronger attacker ROI and a very active research/infosec scene, with professional pentesting services, where widely documented instrumentation tools and ready-made scripts (e.g., Frida/Objection pinning-bypass playbooks) are easy to use.
Regional distribution of Hooking incidents
Debugging
Debugging lets an attacker to inspect an app while it runs, which can expose memory, keys, or internal logic. When debugging features are misused, they give attackers a view into an app's internals. An attacker can read memory, extract keys, or trace code paths to find and reproduce vulnerabilities. Unauthorized debugging is often an early sign of reverse engineering or active compromise attempts.
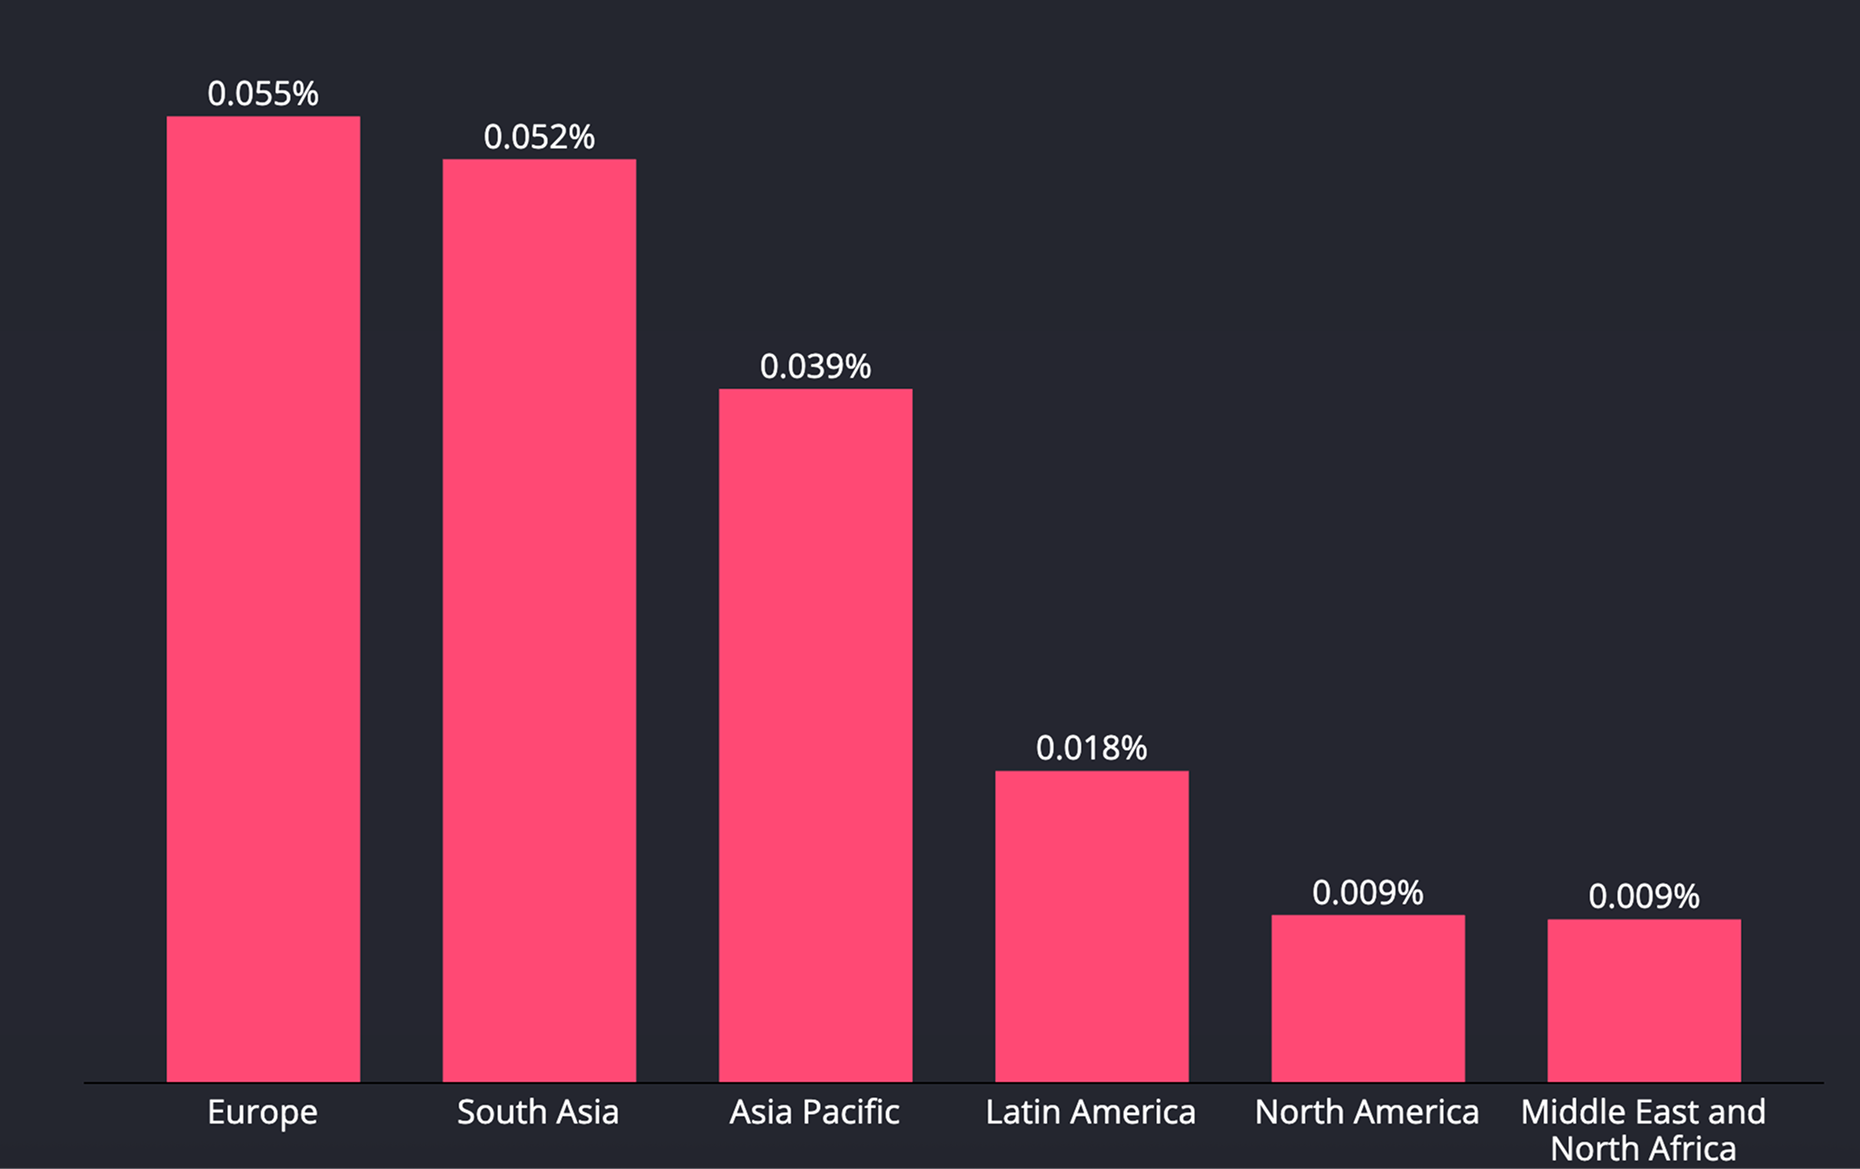
Data Explanation
The chart shows the share of devices that experienced a debugging incident by region.
Europe leads at 0.055%, closely followed by South Asia at 0.052%; Asia Pacific registers 0.039%, Latin America 0.018%, and both North America and MENA are lowest at 0.009% each.
In relative terms, Europe sees about six times North America and MENA, three times Latin America, 1.4 times Asia Pacific and only slightly above South Asia.
Europe’s mature regulatory ecosystem and active bounty communities drive more dynamic probing. Lower rates in North America and MENA may reflect a higher share of managed devices where enterprise policy commonly blocks debugging features.
Regional distribution of Debugging incidents
Screenshoting / Screen Recording
Screenshotting and screen recording occur when a visual copy of an app is taken while it runs. When abused, these captures can leak private data like bank balances, passwords, authentication codes, or personal messages. Both casual accidental captures and deliberate malicious recordings are threats to user privacy and to application security.
Attackers often combine screenshotting or screen recording with techniques such as hooking or repackaging. They may also publish apps that run hidden background capture. By automating these tools and distributing the apps widely, an attacker can harvest credentials and other sensitive data from many devices at once.
Attackers often combine screenshotting or screen recording with techniques such as hooking or repackaging. They may also publish apps that run hidden background capture. By automating these tools and distributing the apps widely, an attacker can harvest credentials and other sensitive data from many devices at once.
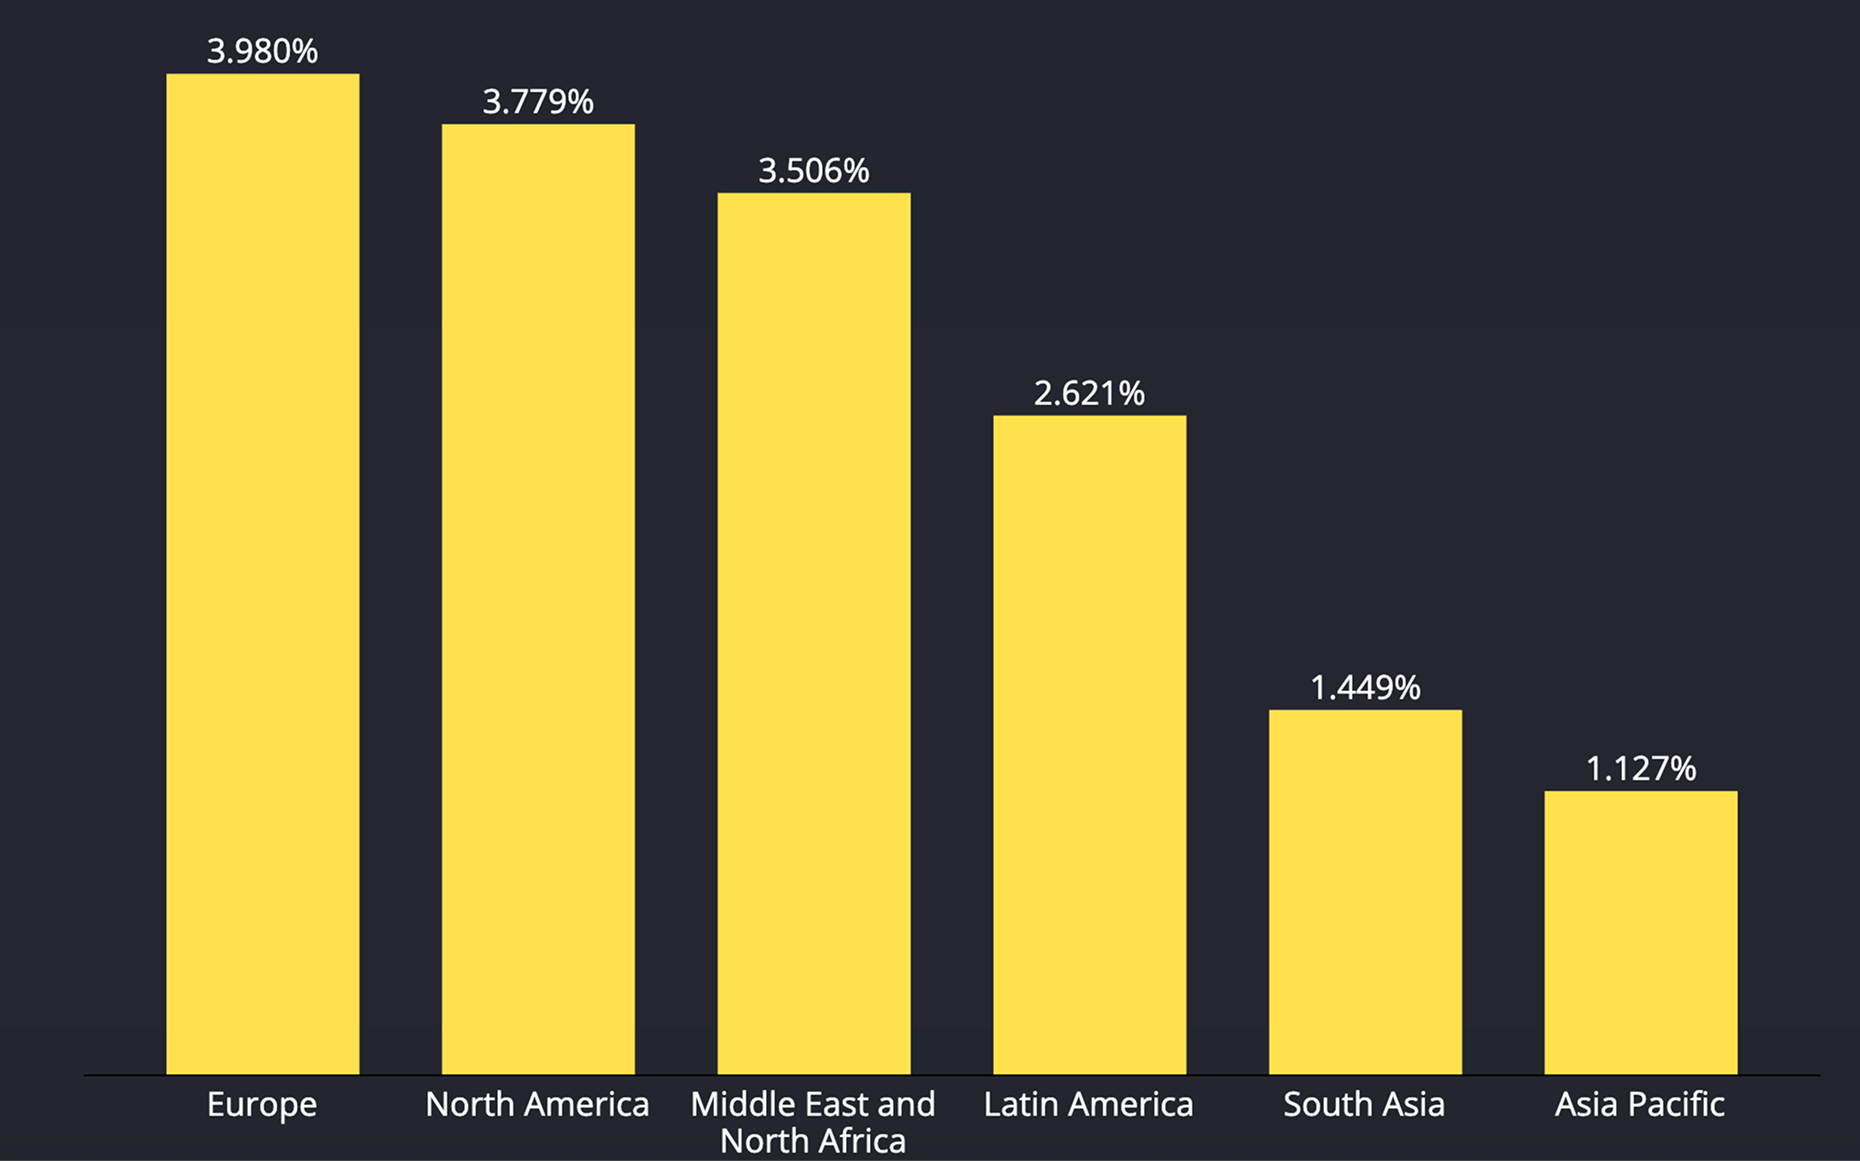
Data Explanation
The chart shows the share of devices that experienced a screenshotting or screen recording incident by region.
Europe leads at 3.98%, followed by North America 3.779% and the Middle East & North Africa 3.506%; Latin America registers 2.621%, while South Asia and Asia Pacific are lowest at 1.449% and 1.127% respectively.
In relative terms, Europe sees roughly 3.5 times Asia Pacific and 2.7 times South Asia; North America shows about 3.4 times Asia Pacific, and about 1.1 times MENA.
Higher rates in Europe, North America, MENA and Latin America reflect intense pressure from fraud operations and banking-focused malware that rely on screen capture/streaming.
Regional distribution of Screenshoting / Screen Recording incidents
Device Compromise & Environment Risks
Although these factors may not directly damage the application, they alter the device environment in ways that enable or facilitate potential attacks. Such indicators often act as early warning signs of an impending compromise targeting your application.
Root / Jailbreak
Rooting (Android) or jailbreaking (iOS) refers to obtaining privileged system-level access by bypassing the device’s built-in security restrictions. This significantly increases the attack surface, enabling malicious actors to execute arbitrary code, disable critical security controls, or install unauthorized applications.
Threat actors continuously develop and distribute new methods to exploit vulnerabilities that allow privilege escalation. A rooted or jailbroken device represents a security breach as the application can no longer trust the device, its security controls, or even its own execution environment. However, not every rooted or jailbroken sign might be an attacker. Some users perform this to bypass manufacturer-imposed limitations and customize their devices and systems to their wants.
Threat actors continuously develop and distribute new methods to exploit vulnerabilities that allow privilege escalation. A rooted or jailbroken device represents a security breach as the application can no longer trust the device, its security controls, or even its own execution environment. However, not every rooted or jailbroken sign might be an attacker. Some users perform this to bypass manufacturer-imposed limitations and customize their devices and systems to their wants.
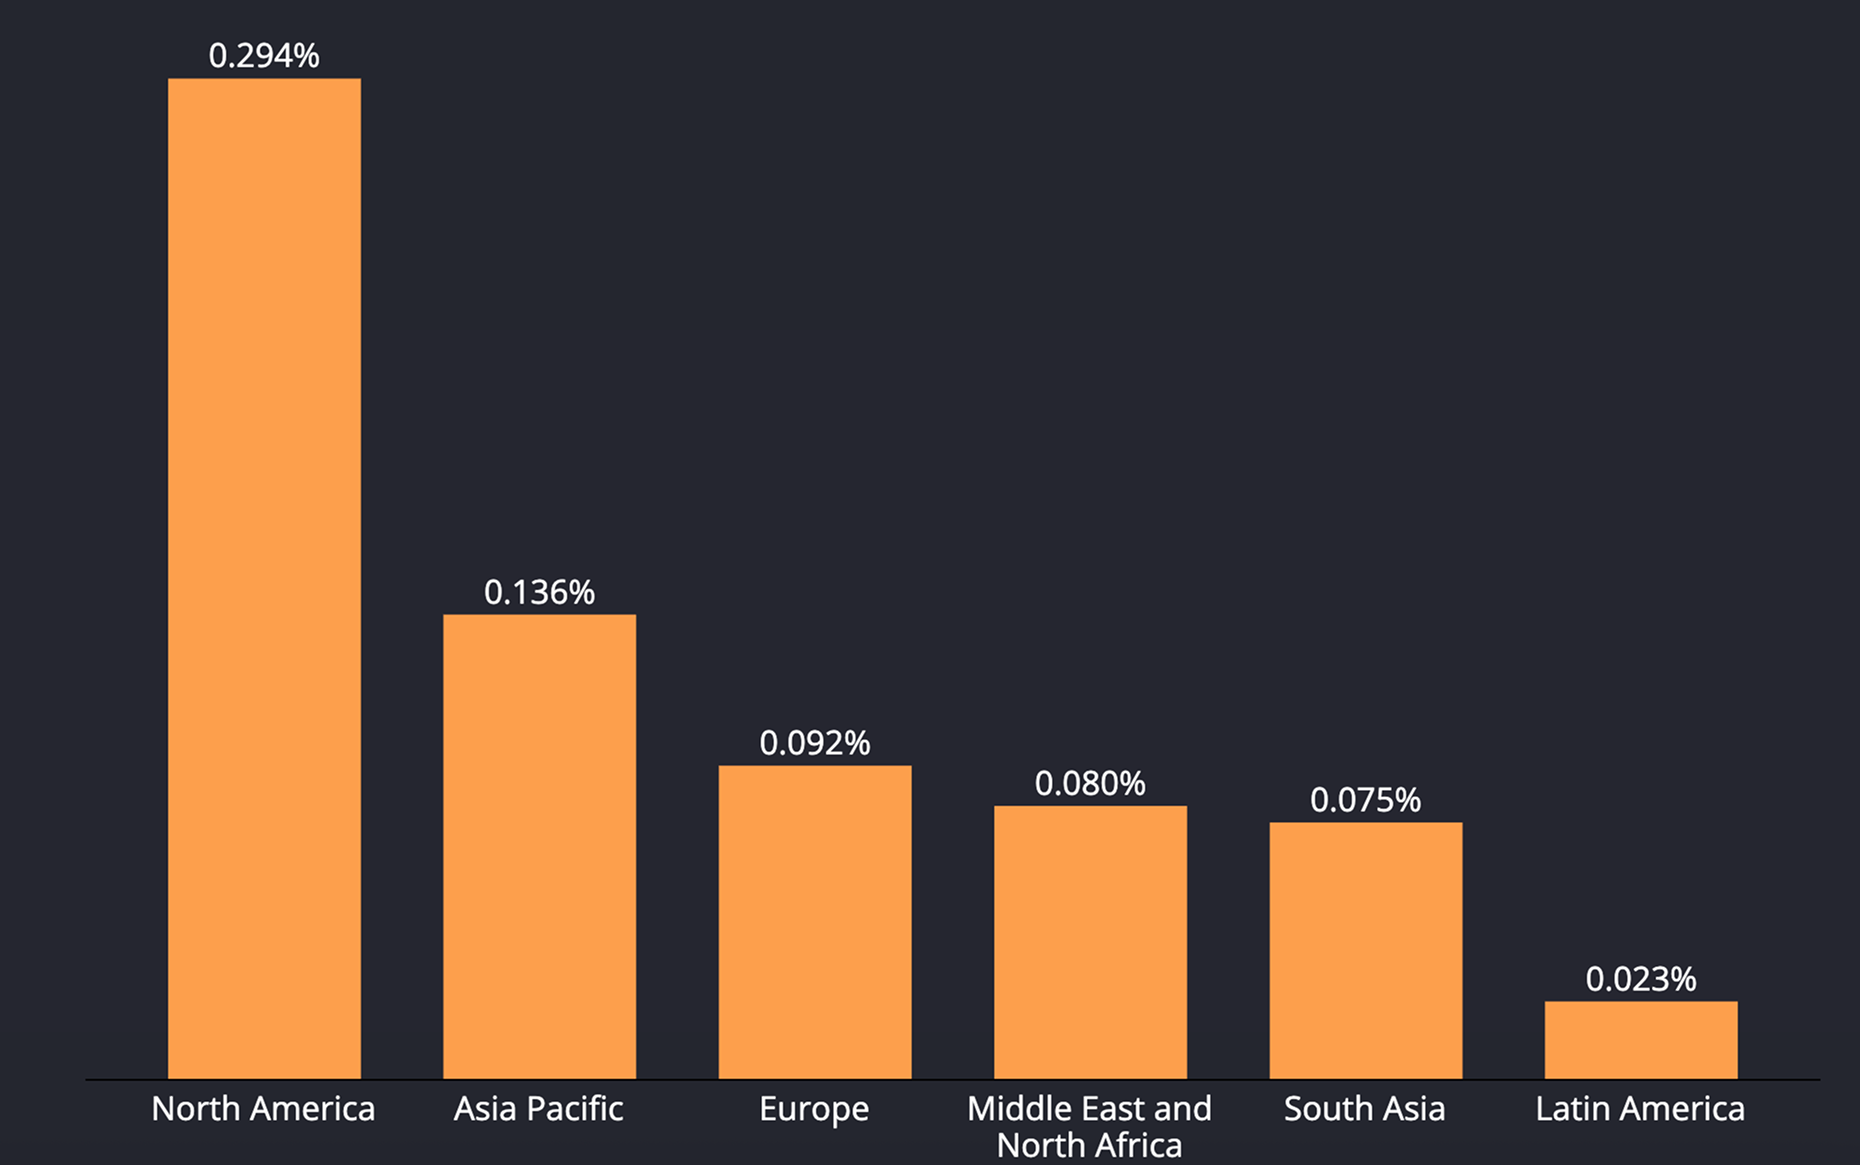
Data Explanation
The chart shows the share of devices that experienced a rooting or jailbreaking incident by region.
North America stands out at 0.294%, followed by Asia Pacific 0.136%, Europe 0.092%, the Middle East & North Africa 0.08%, South Asia 0.075%, and Latin America 0.023%.
In relative terms, North America sees roughly 2.2 times Asia Pacific, 3.2 times Europe, 3.7 times MENA, 3.9 times South Asia, and about 12.8 times Latin America.
North America’s top rate reflects permissive norms and large modding communities that lower the barrier to rooting, while low Latin America rate aligns with fraud patterns toward social-engineering scams rather than device compromise.
Regional distribution of Root / Jailbreak incidents
Simulator
Emulated and simulated environments can be easily modified or controlled, attackers may use them to reverse-engineer applications or to bypass security features. Because emulators often lack hardware backed protections, they make key extraction, scripting, and large scale abuse easier. The usage of emulators is more prevalent in the gaming industry.
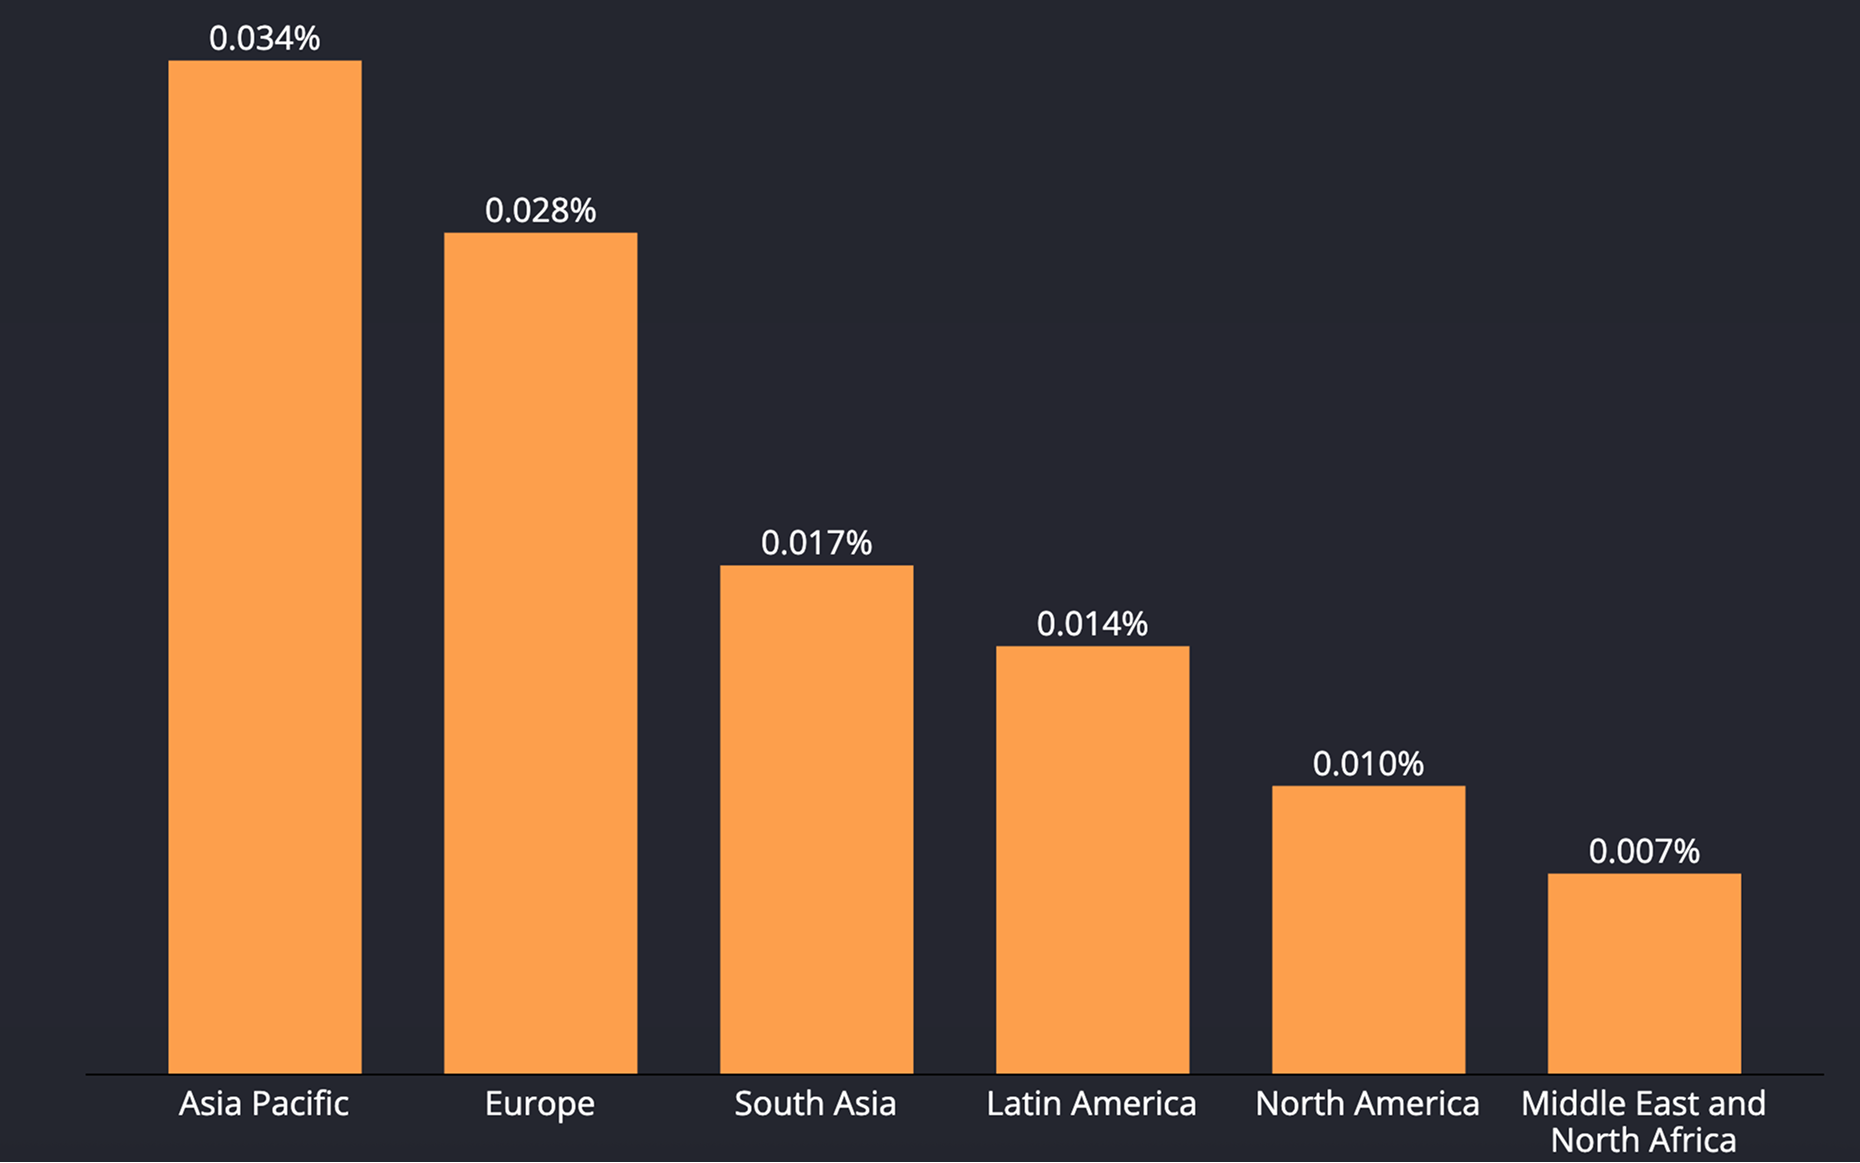
Data Explanation
The chart shows the share of devices that experienced a simulator incident by region.
Asia Pacific stands at 0.034%, followed by Europe 0.028%; South Asia registers 0.017%, Latin America 0.014%, North America 0.01%, and MENA is lowest at 0.007%.
In relative terms, Asia Pacific is about 3.4 times North America and 4.9 times MENA, while Europe is 2.8 times North America.
Higher rates in Asia Pacific and Europe reflect heavy reliance on game emulators and organized emulator/click-farm automation for installs and fraud, amplified by easy scaling in virtualized setups.
Regional distribution of Simulator incidents
Developer Mode
Developer Mode gives access to tools and information that help test and debug applications. However, it also reduces the device’s overall security. With developer mode enabled, protections that normally safeguard user data are relaxed, increasing the risk of misuse or attacks. For example, it enables USB debugging, which can sometimes be exploited as a bridge to gain root access.
While developer mode alone is not inherently dangerous (most mobile developers have it enabled) it is a useful signal when combined with other threats such as rooting, app tampering, or debugging. Monitoring developer mode status can help identify higher risk devices or potential compromise attempts.
While developer mode alone is not inherently dangerous (most mobile developers have it enabled) it is a useful signal when combined with other threats such as rooting, app tampering, or debugging. Monitoring developer mode status can help identify higher risk devices or potential compromise attempts.

Data Explanation
The chart shows the share of devices that that have developer mode enabled by region.
South Asia stands out at 1.147%, followed by MENA 0.114%, Asia Pacific 0.099%, Latin America 0.027%, Europe 0.01%, and North America 0.003%.
In relative terms, South Asia is about 10 times MENA and 11.5 times Asia Pacific, over 42 times Latin America, 115 times Europe, and 382 times North America.
For South Asia, patterns are consistent with wider sideloading (unofficial store) and informal distribution that encourage enabling developer mode.
Regional distribution of devices with Developer Mode enabled
ADB Enabled
ADB (Android Debug Bridge) Enabled is a power-user feature activated through the "USB Installation" option in the Developer settings. This state can signal potential security risks, such as apps being installed via USB, the device being connected to a man-in-the-middle (MiTM) proxy, or the device running as an emulator.
When ADB is enabled, it allows extensive access to the device, including pulling and pushing files, issuing shell commands, working with the activity manager (e.g., starting activities, broadcasting intents, modifying hidden Android settings, attaching a profiler to a process, or making an app debuggable), and managing packages.
When ADB is enabled, it allows extensive access to the device, including pulling and pushing files, issuing shell commands, working with the activity manager (e.g., starting activities, broadcasting intents, modifying hidden Android settings, attaching a profiler to a process, or making an app debuggable), and managing packages.
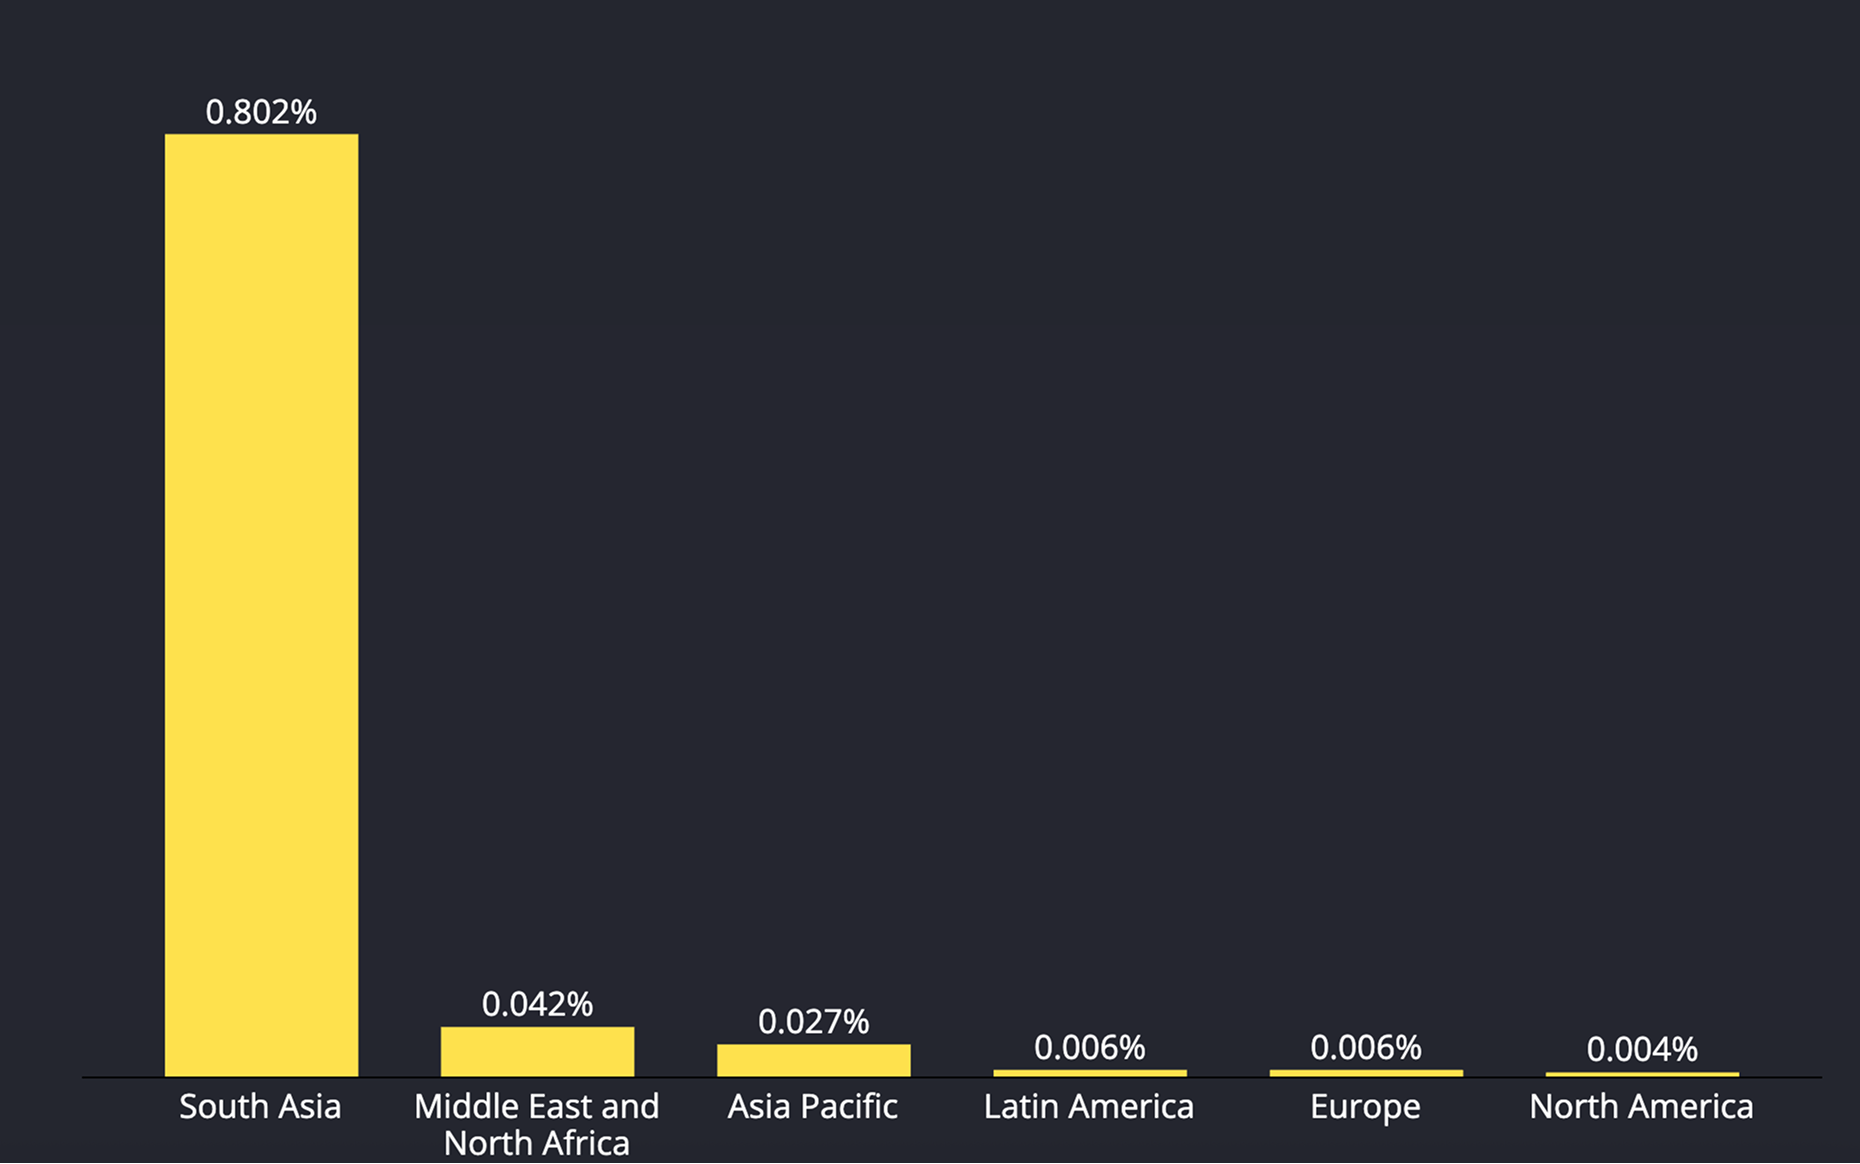
Data Explanation
The chart shows the share of devices that that have ADB enabled by region.
South Asia stands out at 0.802%, followed by MENA 0.042%, Asia Pacific 0.027%, Latin America 0.006%, Europe 0.006%, and North America 0.004%.
In relative terms, South Asia is about 19 times MENA and 29 times Asia Pacific, over 133 times Latin America and Europe, and 200 times North America.
This incident type strongly correlates with the Developer Mode, as people often have both these settings enabled.
Regional distribution of devices with ADB enabled
System VPN
Virtual Private Network (VPN) is a secure network tunnel that encrypts traffic and routes it through remote servers. It can also mask the origin of requests, hiding the user’s location.
While VPNs are generally considered a positive security practice, there are cases where their use may conflict with regulations or organizational policies. For example, a VPN can obscure online activity from network monitoring systems, which may violate workplace, school, or government rules that require visibility or content filtering. VPNs can also be used to bypass regional restrictions for content distribution, including app stores or video-on-demand services.
While VPNs are generally considered a positive security practice, there are cases where their use may conflict with regulations or organizational policies. For example, a VPN can obscure online activity from network monitoring systems, which may violate workplace, school, or government rules that require visibility or content filtering. VPNs can also be used to bypass regional restrictions for content distribution, including app stores or video-on-demand services.
Data Explanation
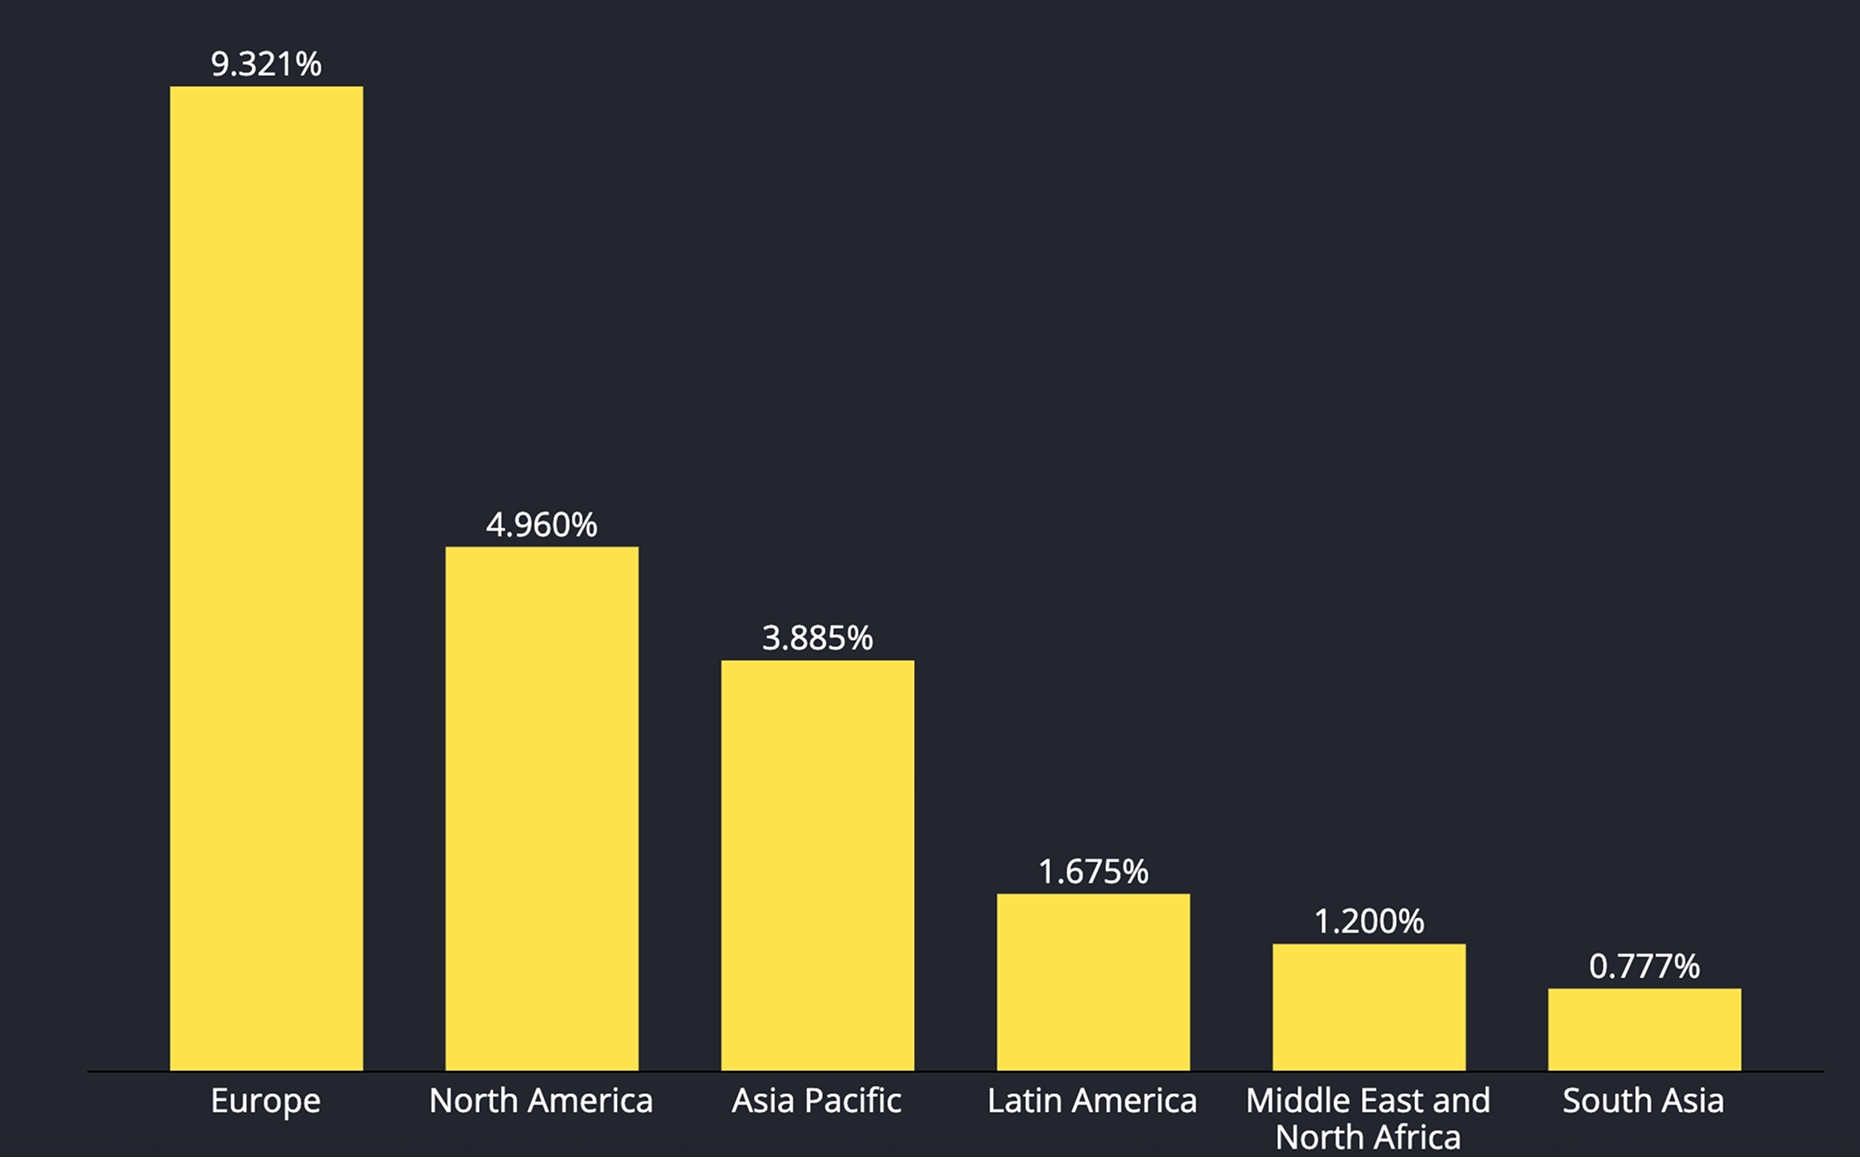
The chart shows the share of devices that that have system VPN enabled by region.
Europe stands out at 9.321%, followed by North America 4.960% and Asia Pacific 3.885%; Latin America registers 1.675%, MENA 1.2%, and South Asia is lowest at 0.777%.
In relative terms, Europe is about 2.4 times Asia Pacific and 7.8 times MENA, while North America is 6.4 times South Asia.
These patterns track mainstream consumer adoption of VPNs in Europe/North America for privacy and geo-restricted content, plus broad availability across workplaces and homes. Asia Pacific’s elevated level reflects pockets of very high national uptake and censorship workarounds.
Regional distribution of devices with System VPN enabled
Device Specifics
Device specifics map the features and properties of devices in context. It is not only important to understand which threats are currently targeting applications, but also useful to gain insight into the devices themselves. This information provides a broader view of the security posture exercised by users.
OS Versions
OS versions serve as useful indicators for two main reasons. First, they provide insight into the age and type of devices in use. Older OS versions often correspond to older or lower-cost devices, although this is not always the case, as some manufacturers continue to provide updates and security patches for older models. Second, OS versions reflect the security posture of devices. Newer OS versions generally offer better protection against known vulnerabilities and may support newer security features and APIs. Attackers are more likely to discover exploits for outdated, unpatched operating system versions using publicly available information.
Android OS Versions
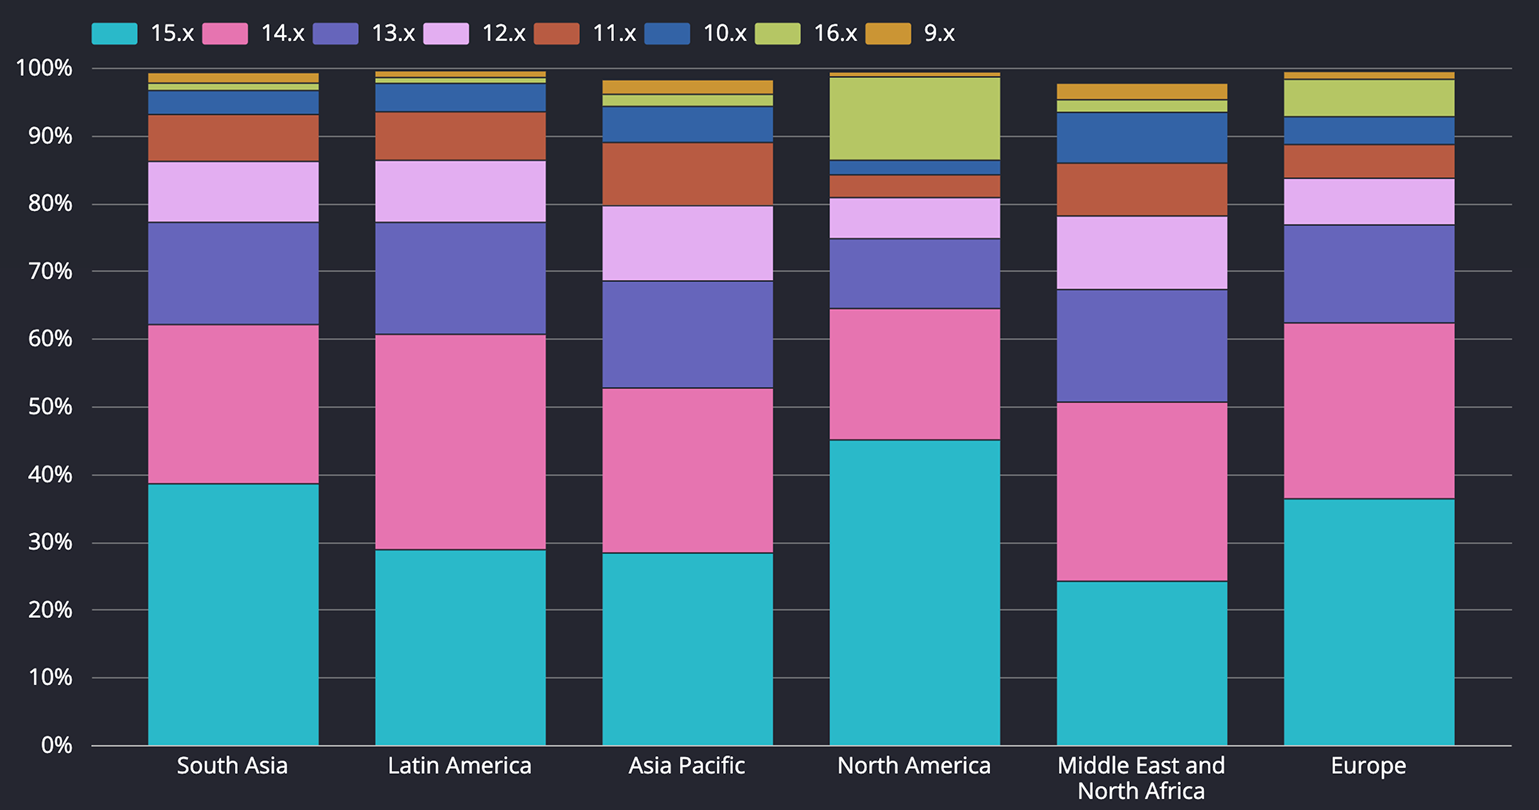
iOS OS Versions

Data Explanation
The charts show the share of devices with specific OS versions by regions.
As for the iOS, most devices run 18.x across regions, with small 17–15 tails. Also the new iOS 26 is gaining traction a lot recently. This reflects Apple’s centralized updates and rapid security responses. Newer iOS versions continue to receive frequent security fixes, while older releases may miss patches once support moves on.
Regarding the Android, version spread is wide by region. North America is newest, with the highest 16.x and the largest 15.x share; South Asia is also modern but almost no 16.x yet. Europe follows with strong 16/15/14. Latin America leans more on 14.x and 15.x. Asia Pacific and MENA skew older, showing noticeably larger 12/11/10; MENA in particular has the most 10.x while only a small pocket of 16.x appears.
Markets with more refurbished or long-lived devices trend older; premium or enterprise-managed markets update faster. Expect higher exploitability and extra compatibility work where older Android versions persist.
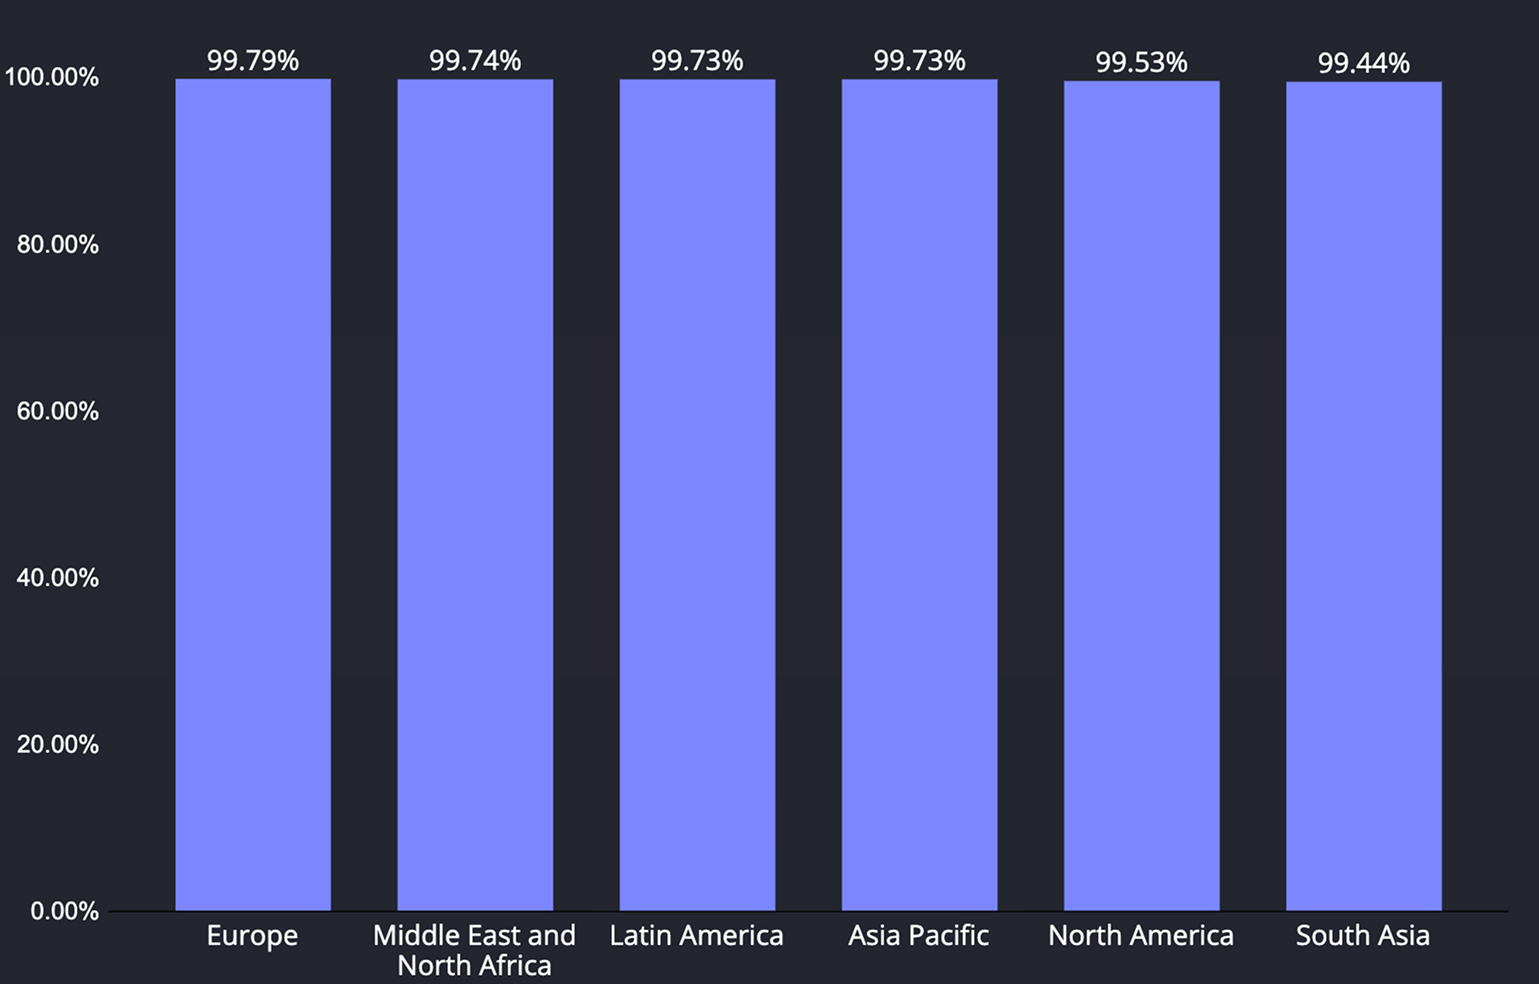
Mobile Services
Mobile services provide manufacturer-specific features such as advertising, location, push notifications, authentication, and mapping. Examples include Google Play Services for most Android devices and Huawei Mobile Services for Huawei devices. Knowing how many users have these services enabled matters because it dictates which SDKs/APIs are dependable at scale, the reliability of critical features (push, maps, location, sign-in), the availability of device-integrity and fraud signals, and the size of the monetizable audience for ads and analytics.
Has Google Play Services

Has Huawei Mobile Services

Data Explanation
Huawei Mobile Services (HMS) is highest in MENA (6.31%), then Asia Pacific (4.14%) and Europe (3.90%); Latin America (1.20%), North America (0.88%), and South Asia (0.31%) are lower. Google Play Services (GMS) coverage is effectively universal—South Asia 99.91%, Latin America 99.88%, Europe 99.81%, North America 99.41%, MENA 98.66%—with the notable exception of Asia Pacific (93.39%).
In relative terms, the Asia Pacific's GMS gap aligns with mainland China’s long-standing block on Google services and post-2019 restrictions that prevent new Huawei phones from shipping with GMS, which in turn lifts HMS/AppGallery usage; higher HMS in MENA and parts of Europe reflects Huawei’s active ecosystem presence, while North America’s very low HMS corresponds to U.S. restrictions and low Huawei share.
In relative terms, the Asia Pacific's GMS gap aligns with mainland China’s long-standing block on Google services and post-2019 restrictions that prevent new Huawei phones from shipping with GMS, which in turn lifts HMS/AppGallery usage; higher HMS in MENA and parts of Europe reflects Huawei’s active ecosystem presence, while North America’s very low HMS corresponds to U.S. restrictions and low Huawei share.
Other Security Elements
Devices have multiple security features which can tell you about security of device.
Hardware-backed keystore is a feature which allows device to make secure cryptographic operations using dedicated hardware. It provides stronger protection for sensitive keys by isolating them from the main operating system, reducing the risk of extraction and unauthorized access.
Screen Lock is useful indicator of how the user is securing a device. Knowing how many users have a screen lock enabled is important because devices without it are more vulnerable to unauthorized access and data theft.
Biometrics then work in tandem with screen lock, being important as it strengthens device security by providing a more reliable and convenient way to protect user data against unauthorized access.
Hardware-backed Keystore
Screen Lock
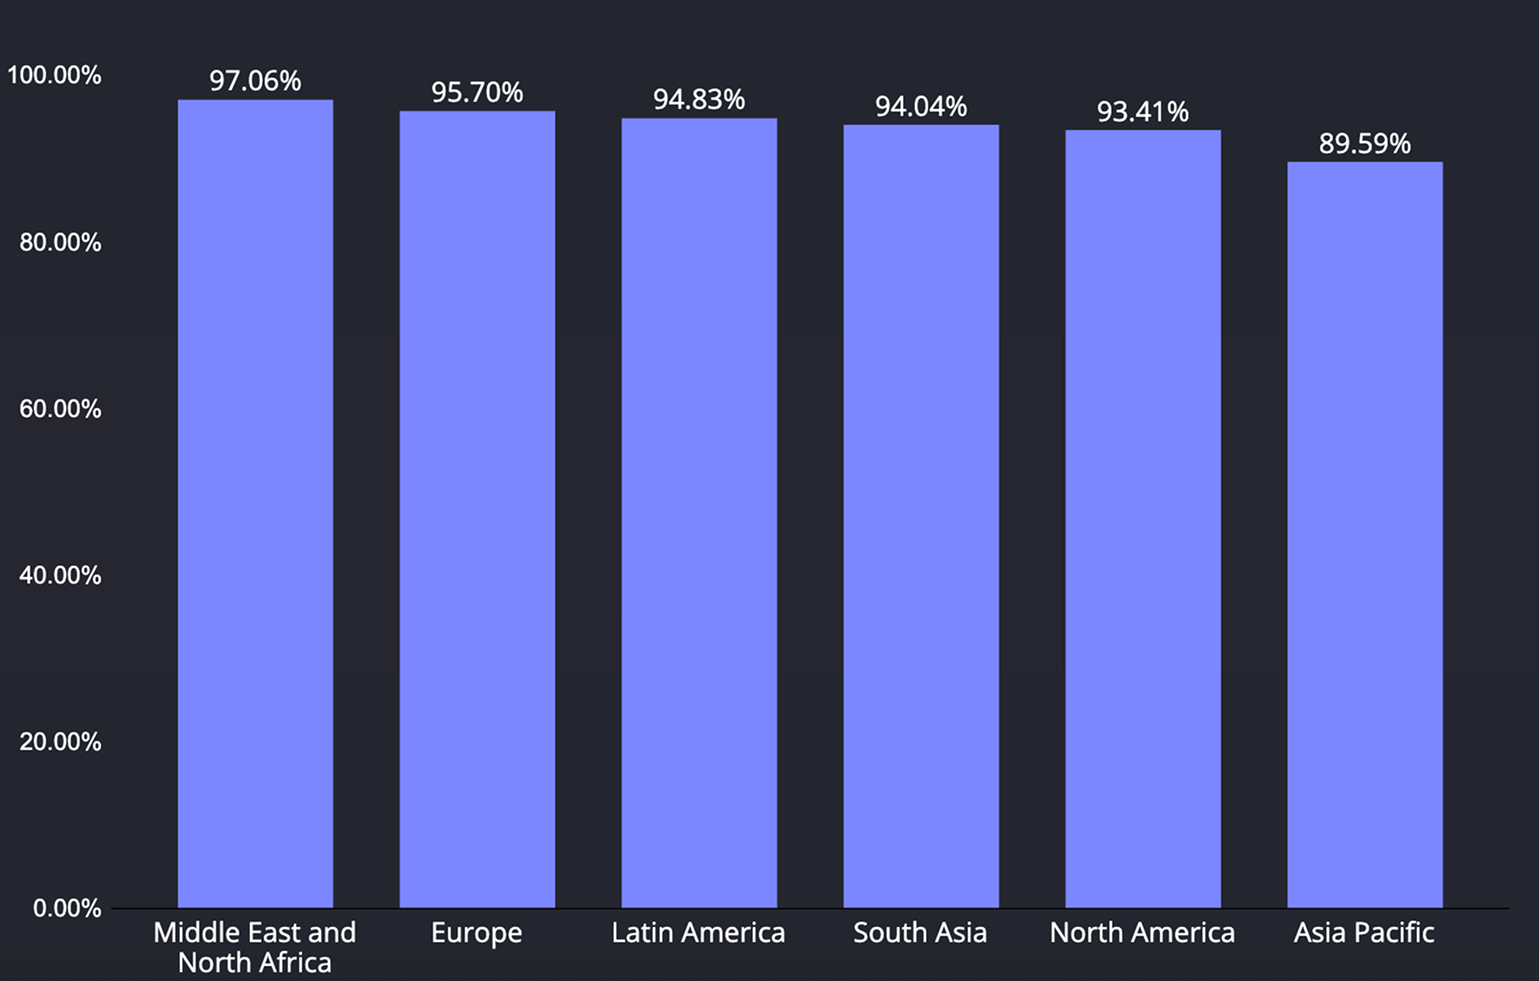
Biometrics
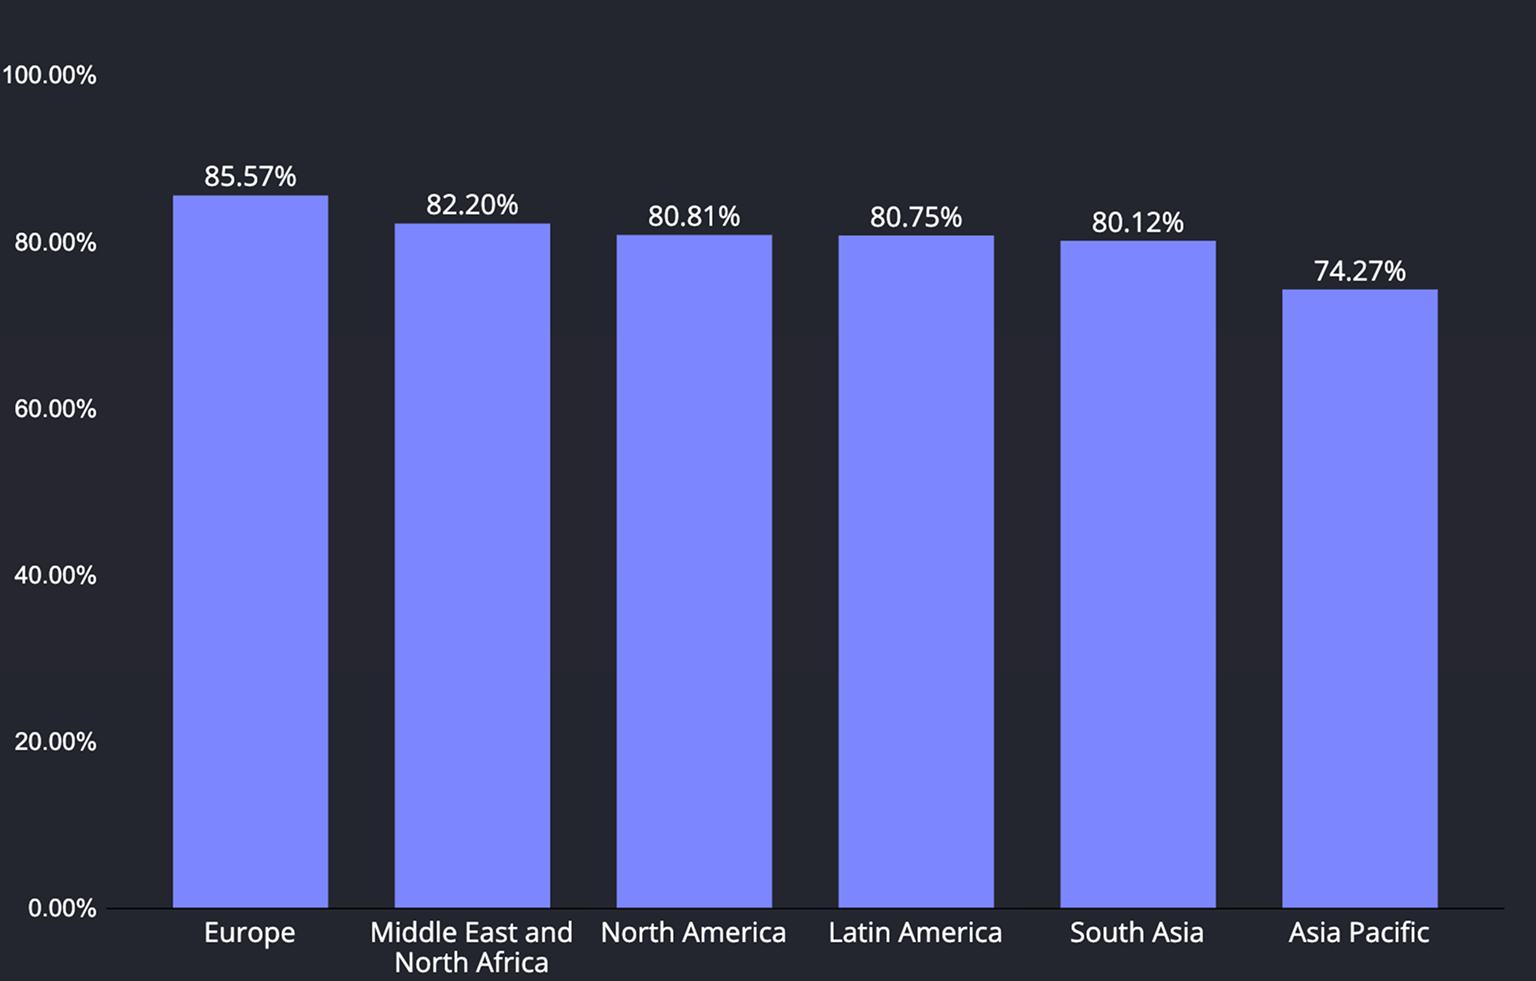
Data Explanation
As for biometrics, Europe has the strongest adoption, with MENA, North America, Latin America, and South Asia grouped just a little lower; Asia Pacific notably trails the pack by roughly a ten-point margin. This means biometric sign-in is widely usable almost everywhere, but APAC will require more fallback paths.
Regarding screen lock, MENA shows the highest lock-use, Europe and Latin America close behind, and North America/South Asia only slightly below that cluster. Asia Pacific again sits lowest, creating a visible gap in baseline device protection compared with other regions.
As for Hardware-backed keystore, support is essentially universal across all regions—the differences are negligible—so secure, hardware-isolated keys can be assumed. The real regional variation comes from user posture (locks and biometrics), not from missing cryptographic hardware.
Conclusion — RASP protection is a must
Runtime Application Self-Protection (RASP) closes the gaps by monitoring and defending the app from within: detecting in-memory manipulation, hooking frameworks, unauthorized signing/repacks, and risky runtime conditions in real time. Deploying RASP reduces the window of exposure, prevents many common bypasses (e.g., Frida-style instrumentation or repackaged binaries), and provides the telemetry needed to prioritise responses where attackers are most active.
RASP protection is especially critical for sectors where trust and data integrity are paramount — such as financial institutions, healthcare, and other regulated industries — where even a single compromise can lead to severe financial loss, privacy violations, and regulatory consequences. In these environments, in-app protection is not just a security enhancement but a compliance and business necessity.
Source of data: anonymized security diagnostics data from thousands of mobile applications integrating the freeRASP SDK.
Don’t Just Read History. Watch it Happen.
The 2025 Report is a snapshot. Register to the Talsec Customer Portal to access our live analytics dashboard and monitor global threats in real-time.
Access Live Analytics